

What is a project health score? Formula, factors, worked example
Understand how project health scores help evaluate project performance, identify potential risks, and improve delivery decisions. Explore key metrics, weighted scoring formulas, and practical calculation examples to keep projects on track.

Table of Contents (6 sections)
At the time of the weekly status reviews, project portfolios are frequently assessed by using qualitative indicators like Red-Amber-Green or RAG status flags – assigned by individual project managers and based on qualitative impressions instead of empirical metrics.
When a project unexpectedly slips in spite of previously reported ‘green statuses, stakeholders are left with unverified justifications and eroded confidence.
Implementing an objective project health score replaces subjective optimism with data-driven and standardized methodology.
This framework blends weighted delivery signals into a unified metric, enabling transparent evaluation and quick risk detection across operational portfolios.
The short answer
A project health score is a single number, usually 0–100, that shows whether a project is on track. It combines weighted delivery signals - schedule confidence, blocked work, throughput stability, on-time history - into one measure computed from data, not opinion.
Key takeaways
- Spreadsheet implementation – A functional model needs defined factor weights summing to 100% and pre-established scoring bands to ensure objective evaluation.
- Dynamic normalization – Missing data points are automatically excluded from denominator calculations rather than defaulted to zero, preventing unearned penalty distortions.
- Metric discipline – Limiting the model to four to six core factors prevents statistical double counting and metric bloat.
- Forward looking prioritization – Predictive metrics are weighted more heavily than historical lagging indicators.
- Empirical computation – Health scores are calculated objectively from measurable operational factors and mapped to standardized performance bands, eliminating managerial bias.
What project health metrics go into the score?
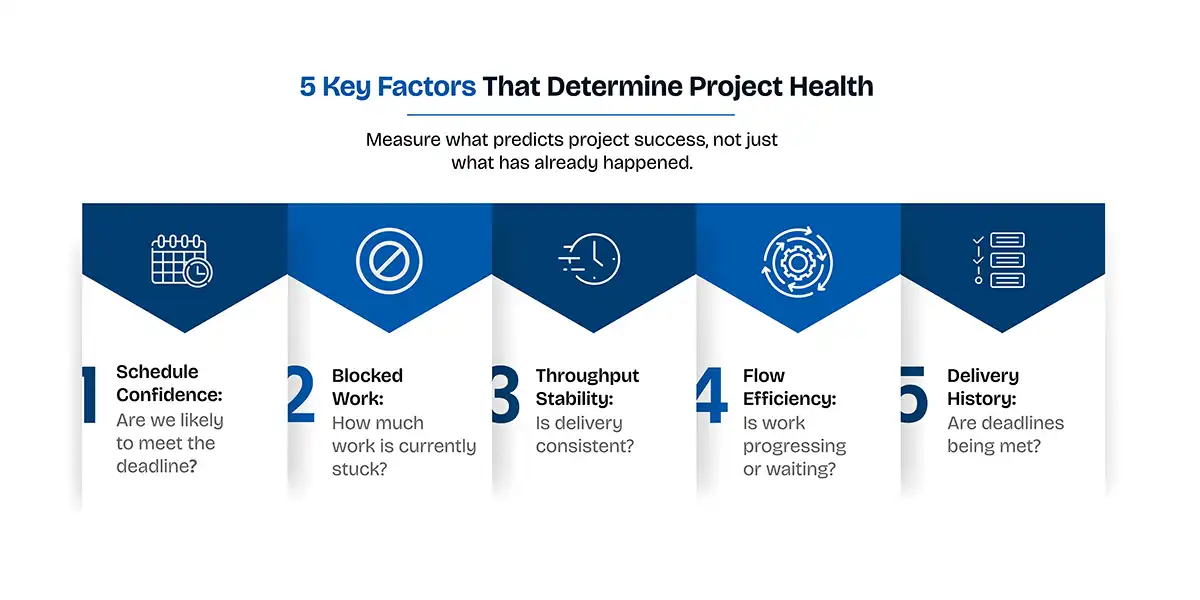
Credible models circle the same five factor families - each answering a question a stakeholder actually asks:
| Factor family | The question it answers | A measurable signal | Measurable operational signal |
|---|---|---|---|
| Schedule confidence | "Will we hit the date?" | Share of forecast runs that land on or before the target date | Percentage of simulation runs projecting completion on or before the deadline. |
| Blocked work | "How much is stuck right now?" | Share of open work not waiting on a blocker | Share of open tasks not impeded by external dependencies. |
| Throughput stability | "Is delivery steady or lumpy?" | How consistent the daily completion rate has been | Variance coefficient of daily completed task volume. |
| Flow efficiency | "Is work moving or waiting?" | Share of elapsed time that work was actively progressing | Proportion of active tasks remaining below the 85th percentile aging threshold. |
| Delivery history | "When we promise, do we keep it?" | Share of completed tasks finished on or before their due date | Percentage of completed tasks finished on or before their due dates. |
Notice what's not on the list: overdue counts, velocity charts, unassigned-work tallies. They are useful project health metrics and belong on a project health dashboard - as context around the score, not inside it. An overdue ratio and an on-time rate are the same failure seen twice; score both and you double-count it.
Scope quietly outgrowing the estimate is its own signal, with its own early warnings - we take it apart in Scope drift: how it starts, and the four signals that catch it early (planned).
Why does a weighted formula beat gut feel?
Because gut feel produced Meridian. Ask a PM mid-sprint how it's going and you'll hear the most recent good news - the demo went well, the blocker cleared yesterday. It isn't dishonesty; humans summarise by memorable event, while delivery slips by quiet accumulation. PM folklore calls the result a watermelon project - green outside, red once cut open. Most late projects were late long before anyone said so - the gap we walk through in Your project was late three weeks before anyone said so (planned).
A weighted formula changes the meeting more than the number. Same Monday, same row seven - but Meridian reads 54, orange, and the "why" travels with it: a third of its open work is blocked, and six forecast runs in ten miss the date. Nobody debates the colour, because nobody chose it - the argument moves to the blocker, which is the argument you wanted. That is the whole case: consistent across projects, inspectable down to its factors, indifferent to how persuasive the PM is.

What is the project health score formula? A worked example
Formulas differ by tool, and a made-up "industry standard" would help nobody. So here is the real model inside the one we build - Project Pulse in TruTimer - as a concrete example. The shape transfers to any spreadsheet.
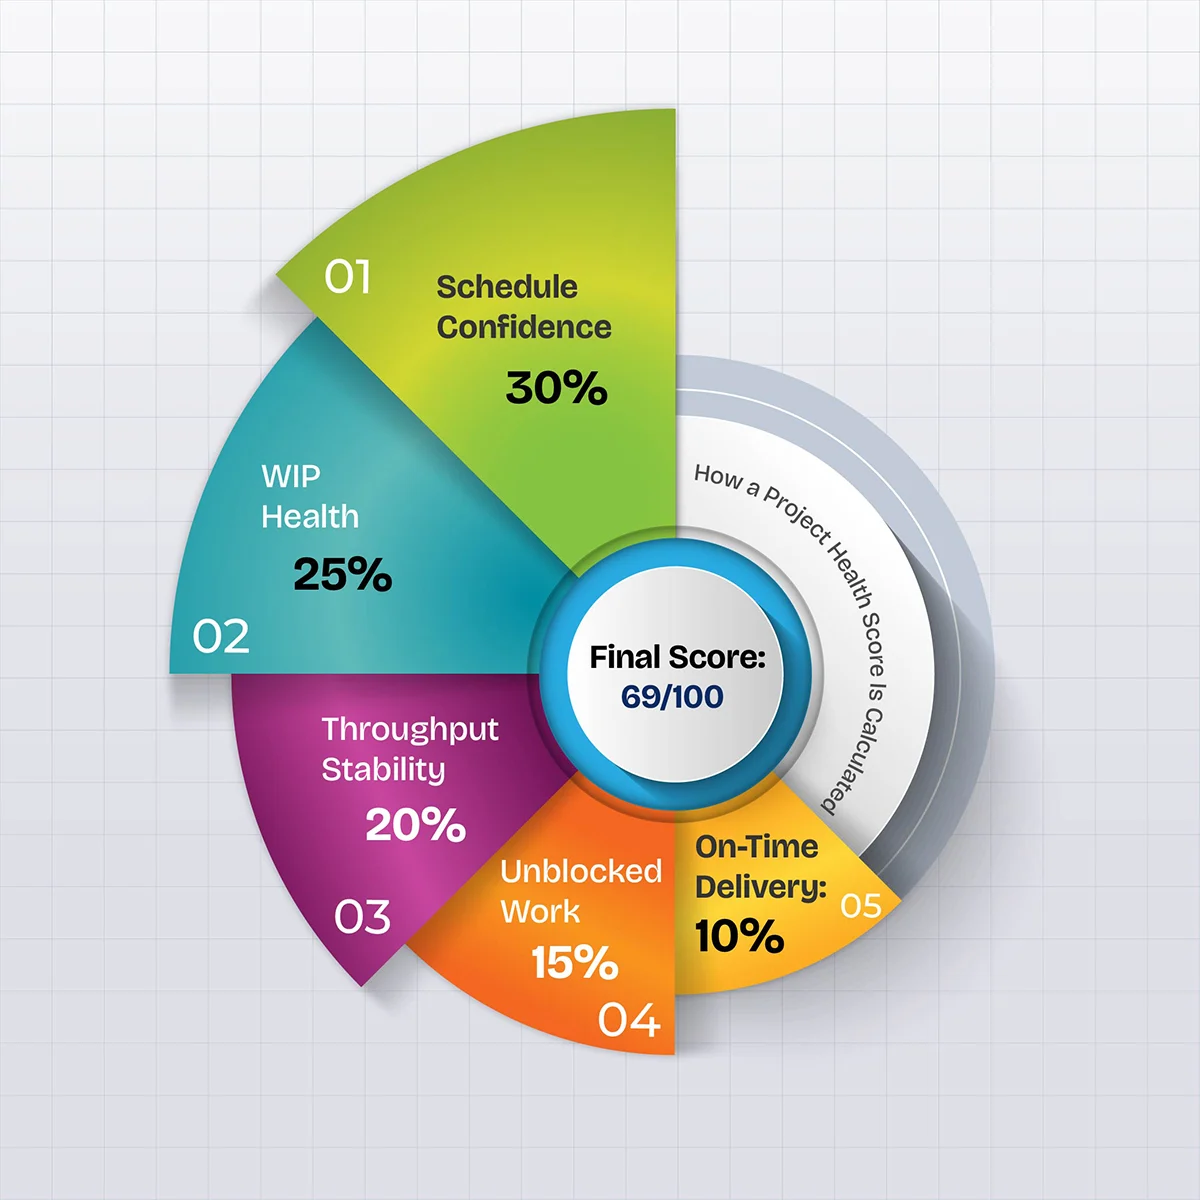
The score is a weighted mean of five factors, each expressed 0–100:
| Factor | Weight | Plain meaning |
| --- | --- | --- |
| Schedule Confidence | 30% | Share of simulation runs finishing by the target date - recent delivery pace is replayed many times, and the factor is how often the date holds |
| WIP Health | 25% | Share of in-progress work still inside the team's normal cycle time - calculated as 100 minus the percentage of work-in-progress aging past the p85 mark. Aging work-in-progress is the leading indicator of a bottleneck (Reinertsen, Principles of Product Development Flow) |
| Throughput Stability | 20% | How steady the daily completion rate has been - erratic scores low |
| Unblocked | 15% | Share of open work not blocked |
| On-Time Delivery | 10% | Share of completed tasks finished on or before their due date |
Note the ordering: over half the weight is forward-looking or live flow; only 10% is history. A health score's job is to predict trouble, not memorialise it.
One deliberate difference from the generic table above: the second factor here measures aging work-in-progress, not Kanban flow efficiency (active time ÷ total elapsed time). They sound alike and behave differently. Aging asks "how much of what's open has been open too long?", which surfaces a forming bottleneck earlier than a ratio of active-to-waiting time does. Either is defensible - just don't assume a factor called something familiar is computing what you expect. Ask any vendor for the arithmetic.
Five other metrics - Velocity Trend, Estimation Accuracy, Unassigned Work, Overdue Ratio, Schedule Adherence - are computed and shown on the same dashboard but sit outside the score. They are context; changing them does not move the number.
A worked example - all values illustrative. Take a project - call it Kestrel:
| Factor | Weight | Value (illustrative) | Contribution |
|---|---|---|---|
| Schedule Confidence | 30% | 60 | 18.0 |
| WIP Health | 25% | 56 | 14.0 |
| Throughput Stability | 20% | 80 | 16.0 |
| Unblocked | 15% | 90 | 13.5 |
| On-Time Delivery | 10% | 75 | 7.5 |
| Score | 100% | - | 69 |
The 69 then lands in a band:
| Range | Label |
| --- | --- |
| 80–100 | Healthy |
| 60–79 | Needs Attention |
| 40–59 | At Risk |
| 0–39 | Action Needed |
| - | Not Enough Data |
This 69 is steady-but-waiting, with a date closer to a coin toss than a commitment. A blocker-driven 69 is a different project - which is why the factors travel with the score.
What happens when a factor can't be measured?
Suppose Schedule Confidence can't be computed yet - no target date to simulate against. The lazy fix scores it zero, and Kestrel collapses to 51: punished for a missing input. The correct fix drops the factor from both sides of the average - the remaining contributions (14.0 + 16.0 + 13.5 + 7.5 = 51.0) divide by the remaining weight (70%) - and the score reads 73. Same data; one method invented a crisis. When no factor is measurable, an honest model shows "Not Enough Data", never a zero. A brand-new project in TruTimer simply reads "Pulse will appear after your first sprint."
How do you measure project health in a spreadsheet?
You need no tool to start - six decisions and a recurring calendar slot:
Pick four to six factors you can measure from data you already capture - blocked share and on-time rate are countable by hand.
Express each as 0–100. Percentages convert directly; for stability factors, decide what "steady enough" looks like and scale against it.
Assign weights summing to 100%, heaviest on the forward-looking factors.
Compute the weighted mean - when a factor is missing, remove its weight from the denominator rather than scoring it zero.
Agree the bands in advance (the example above breaks at 80 / 60 / 40), so nobody negotiates a colour after seeing their number.
Refresh on a fixed day, before the review - a stale score is gut feel in a spreadsheet costume.
Run it quietly for three weeks first. The first "green" project it reads at 58 is the moment the room starts trusting the number
Two more mechanics worth stealing. The score is plain arithmetic - a weighted mean, clamped to 0–100, no AI in the number - and it refreshes when someone opens the project's Pulse tab, at most once an hour. It also summarises rather than interrupts: deviation from plan escalates on its own tiers - under 10% stays on the card, 10–20% raises a risk alert, 20%+ puts a red banner on the tasks page (threshold per project). A number can't wave its arms; tiers can.
What are the common mistakes with project health scores?
- Scoring everything. Ten factors feel rigorous and measure mush - correlated metrics double-count the same failure. Score a few; display the rest.
- Zero for missing data. New projects read "critical" for being new, and the team learns to ignore red. Renormalise instead.
- Averaging opinions. A formula over self-reported RAG statuses is gut feel with extra steps. Feed it delivery data or don't bother.
- One loud factor. "Health = overdue count" turns the score into an alarm, and alarms get muted. Balance backward signals with forward ones.
- Announcing instead of agreeing. Share weights and bands before the first scored review, or the team spends a quarter attacking the formula.

Frequently asked questions
What is a good project health score?
On a 0–100 scale with bands at 80 / 60 / 40, anything at 80 or above reads healthy. But the trend outranks the level: a 72 that has fallen from 85 over three weeks deserves more attention than a steady 65. Watch direction first, band second.
Is a project health score the same as a RAG status?
No. A RAG status is usually a person's judgment compressed into a colour. A health score is computed from delivery data, then mapped to a colour. It can still be wrong - but it is wrong consistently and inspectably, so you argue with the inputs instead of the opinion.
How often should a project health score update?
Often enough that nobody quotes a stale number in a live meeting. Weekly, on a fixed day, is the floor for a spreadsheet version. Computed scores refresh faster - TruTimer's, for instance, recalculates when someone opens the project's Pulse tab, at most once an hour.
What factors should a project health score include?
Factors that predict the finish rather than describe the past: schedule confidence, share of open work blocked, throughput steadiness, flow efficiency, and on-time history. Four to six is plenty. Keep overdue counts and velocity as dashboard context - scoring them alongside on-time history double-counts the same problem.
Can I calculate a project health score in Excel?
Yes. Score each factor 0–100, weight them to sum to 100%, and take the weighted average - removing any unmeasurable factor from both the numerator and the denominator. The formula fits in one cell. The discipline is refreshing the inputs every week, which is the part teams skip.
The certainty this buys is small and specific. Thursday, 6:10pm, the client asks how the project is really going. You say: "Seventy-three. Down four this week - one blocker, clearing tomorrow." No adjectives, no flinch, no cold moment three weeks from now when a colour you can't reconstruct comes back with a question mark. If you'd rather the arithmetic ran itself - factors, bands, renormalisation and all - see how TruTimer does it. If the spreadsheet version alone gets your Monday review arguing about blockers instead of colours, you've captured most of the value.
Sources: No external statistics are cited, by design. Every product mechanic in the worked example traces to TruTimer's internal product documentation (docs/business-logic.md §2.9, §6.0, §6.1, §6.6b), verified 2026-08-19. All worked-example values are illustrative, not measurements from any real project.